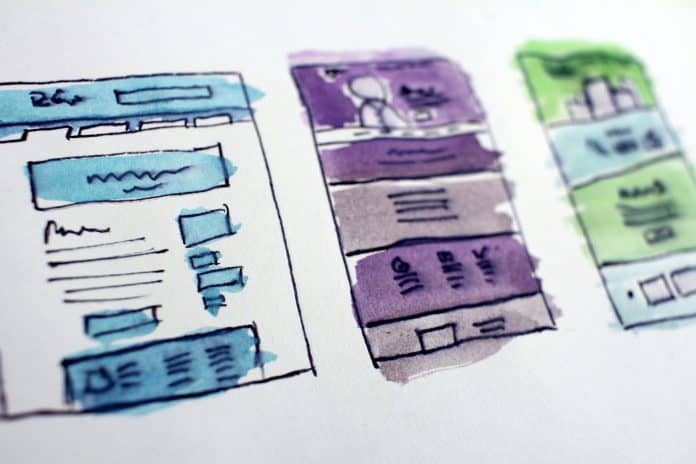
If you are not using infographics as part of your content strategy, then you are seriously missing out. Infographics are a great way to visually show information to your customers and tend to be easier to digest than a bunch of text. They tell a story that is captivating to the reader by combining both graphics and text. Here’s exactly why you should not sleep on infographics and how they can help you reach more people.
Increase exposure
Research can be time-consuming. You want to make sure that you are vetting your resources and finding reliable information. On top of that, you then need to go translate it into something that your audience can easily understand. An ideal way to present your findings is using an infographic. As I mentioned above, it’s a captivating and visually pleasing way to provide information to your audience. If done well, your audience will then turn around and share these infographics with others, effectively increasing the exposure of your content.
It’s not guaranteed that your infographic will be shared, but there are some things you can do to help with sharability. On top of coming up with an original infographic, you’ll want to make sure it is relevant to your audience, visually appealing, follows your branding guidelines, conveys the information in an easy-to-read simple format, and tells something that is worth sharing.
Build brand credibility
Having original infographics that are both interesting and informative can help your audience learn more about you and your business. They can also help establish you as an expert in your field. By establishing yourself as an expert in your industry, you are also building credibility for your brand. Start incorporating infographics into your content to begin building your brand credibility.
Creating a credible infographic does not have to be hard. Simply create a well-design, visually pleasing infographic that gets people talking. Once you’ve got one created, make sure you publish it on relevant and credible sites where someone might go looking for that information. Make sure to share it on your social media pages and if you have relationships with influencers in your industry, encourage them to share it as well. The key to a successful infographic is to keep it fairly simple. The whole point of an infographic is to provide key information in an easy-to-read format.
Improve your SEO
Infographics are extremely effective in driving more traffic to your site, ultimately improving your SEO helping you rank better with Google and other search engines. The most common places you see infographics are in blog posts, social media ads, email marketing, etc. They make it super easy to share important information quickly across platforms. When done right, they help increase engagement and conversions. The key here is that you drive people back to your website. Include your website somewhere on your infographic, but also make sure you hyperlink back to your website on the infographic as well. That way, if someone clicks on it, they are taken directly to the source, you.
The best way to use infographics to improve your SEO is by making them sharable. The more people share them and link to them from their own websites and pages, the better your chances are of appearing higher in search.
Build high-quality backlinks
Link building is an important aspect of SEO, but is often overlooked. This helps you rank higher in Google’s organic search results. You don’t want just any backlink though. You want to make sure the links are from relevant, quality, and reliable websites with their own authority. One of the easiest ways to get a backlink is by guest posting on another website in your industry. Not every website accepts guest posts, but it never hurts to reach out. Some sites may be interested in linking to your infographic in a published piece if it’s relevant to the content. This will create a high-quality backlink that will strengthen your domain authority while also encouraging user engagement on both ends.
Improve decision making
Visuals significantly speed up the rate at which information is processed. The quicker you can process information, the quicker you can make a decision. This is extremely important when presented with a complex idea. The longer and harder it is to understand something, the harder it is to make a decision. If it’s too hard, you may not end up making a decision at all. According to research done by MIT, the human brain can process entire images that the eye sees for as little as 13 milliseconds. If you are trying to present complicated information, infographics can help the brain work through it much faster than if it were text.
Use them digitally and in print
While infographics make for great online content, they can also be used in physical print form. If you have important information to share, why not print out flyers to post around or include them in brochures? An infographic is a great way to break up text-heavy information in your printouts and make the experience of reading them much more pleasant.
If you have an infographic you are ready to print, contact Printivity today at 1-877-649-5463.


